
Two Growth Intelligence tabs in Visioix Pro help you look closer at your content: Ask your analytics answers questions about the selected period, and Authors & content compares groups of posts and pages.
Where to find it: ARN Visioix → Growth Intelligence, tabs Ask your analytics and Authors & content. Choose the Completed period at the top first.
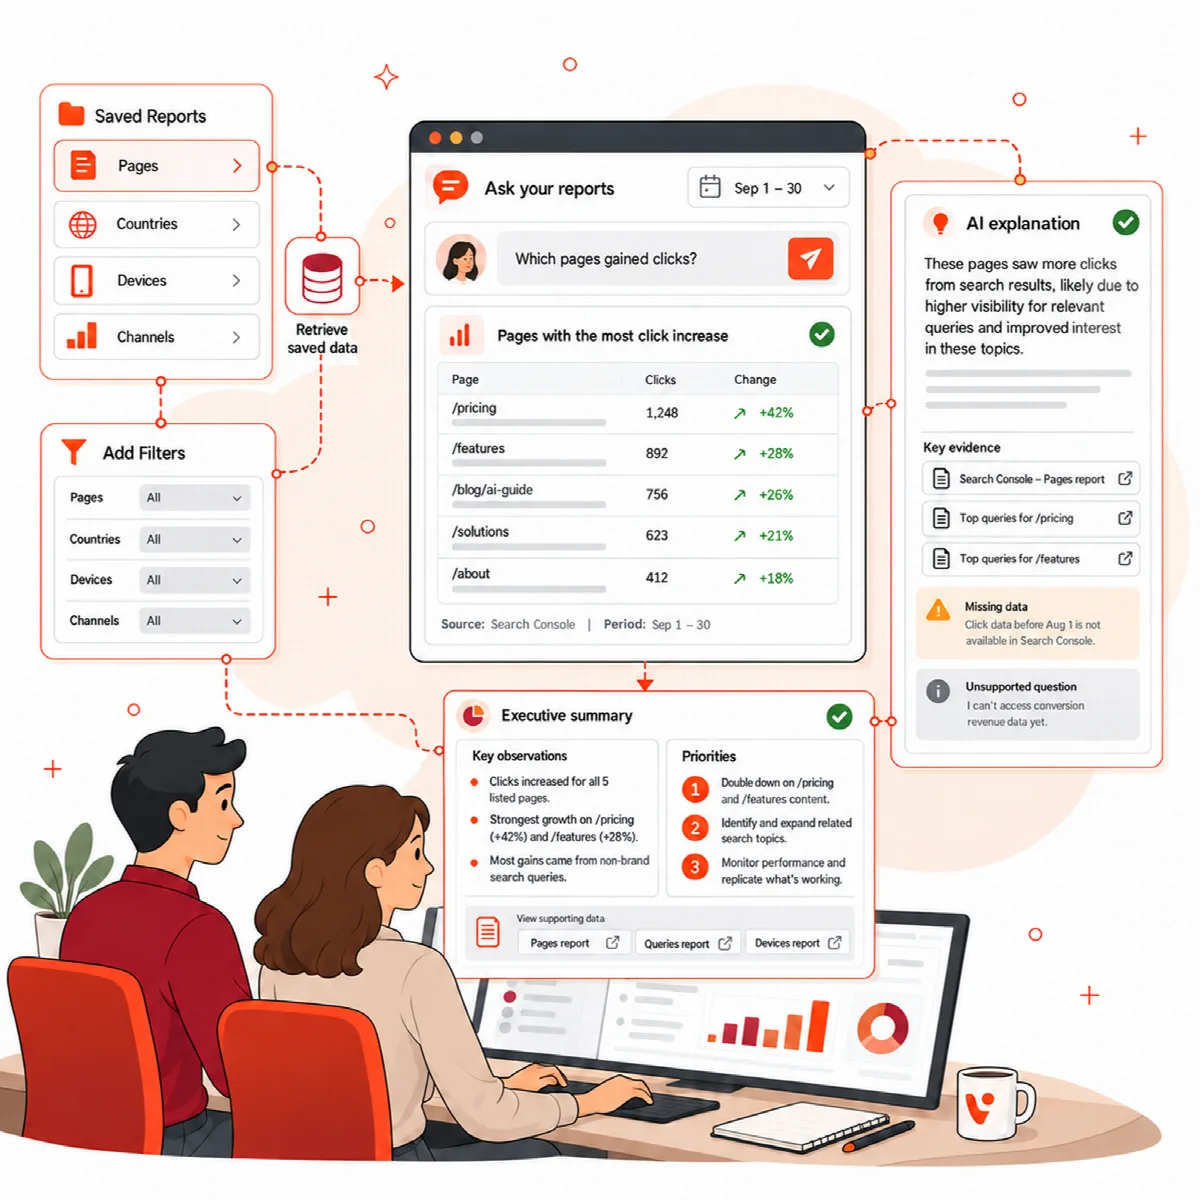
Ask your analytics
- Type a question of 5 to 1000 characters under Ask a question about the selected period, for example "How many sessions came from Turkey?" or "Which pages are declining?".
- Click Ask analytics.
- Read the Result with its Current, Previous and Difference values. Open source report shows the report the numbers came from.
- Optionally click Explain this saved result with AI for a written explanation of exactly those numbers.
Supported questions cover the overview, pages, countries, devices, channels, Search Console totals, editorial groups and WooCommerce currency and product cohorts. You can ask for top, growing or declining results, and an exact value such as a country name filters a ranked report. Questions about money need one currency code, for example USD.
The selected period stays fixed. Questions that the reports cannot answer are rejected instead of being turned into a different report. This includes forecasts and future periods: "Forecasts and future periods are unsupported. Ask about observed data in the selected completed period." For estimates, use Forecast & Early Warning; see Build, schedule and share reports and forecasts.
Compare authors and content
The Authors & content tab matches your published posts and pages with their analytics.
- Read the WordPress content context: how many published posts and pages are in the catalogue and the state of the analytics data.
- Review the groups in the table (see the columns below).
- Choose an Editorial dimension (Authors, Categories, Length, Age or Type) and click Explain this editorial evidence with AI for an explanation.
| Column | What it shows |
|---|---|
| Group | The author, category, length band, age band or content type |
| Posts | Number of posts and pages in the group |
| Current views / matched posts | Views in the current period and how many posts had matching analytics |
| Previous views / matched posts | The same for the previous period |
| Engagement seconds / view: current → previous | Engagement time per view in both periods |
| Lifetime comments | WordPress comment count |
Keep these limits in mind:
- Views cover only pages that appear in the analytics page report. A missing page is not zero traffic.
- Engagement seconds per view weighs every group by its views, so groups of different sizes can be compared.
- Categories overlap; never add category rows to estimate site totals.
- A category with more posts can have more views in total without performing better per post.
- Length and age show associations; they do not prove the ideal article length.
Use the result to pick examples to review, then connect your conclusion to a specific content decision.