
Growth Intelligence compares two completed periods of equal length from Google Analytics and Search Console and lists the changes that the data really supports. It needs Google Site Kit; see Connect Google Site Kit and read Website Intelligence.
Where to find it: Growth Intelligence in the Visioix menu.
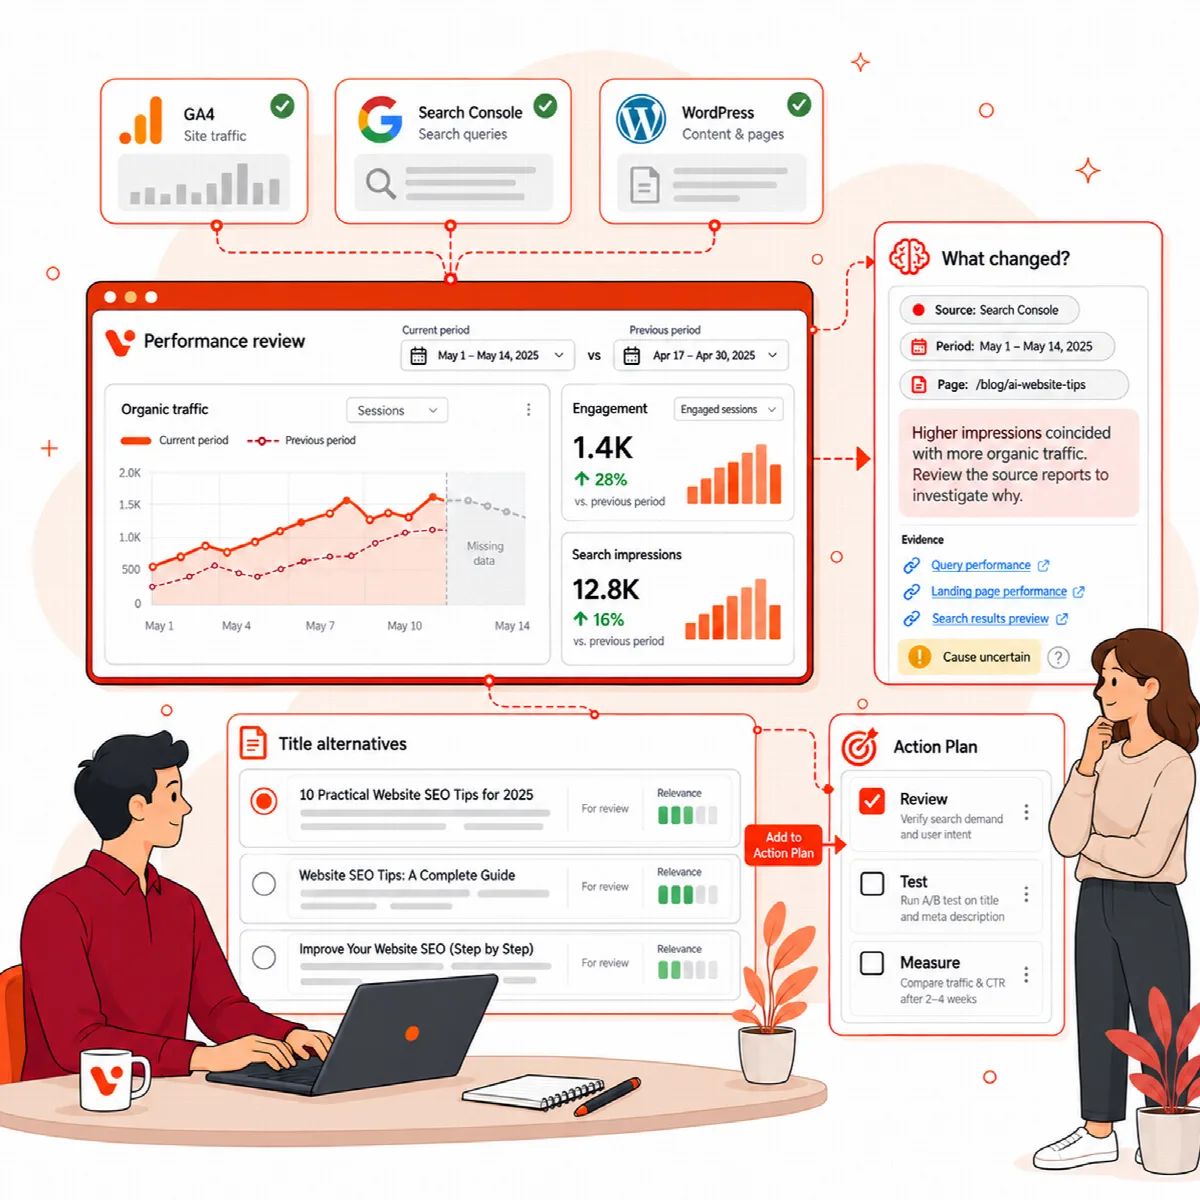
Choose the period
At the top, choose the Completed period: 7 days, 30 days or 90 days, then click Update period. Visioix compares the period that ended yesterday with the period of the same length before it. Data connections opens the Site Kit connection status.
Check the evidence health
The Evidence health card shows, for GA4 and Search Console, whether the two periods can be compared and whether the sample is large enough:
- Comparable, supported sample: the findings rest on enough data.
- Comparable, limited sample: read the findings with care.
- Connected, but the periods cannot be compared, the source's own error message, or Unavailable: fix the connection or choose another period.
In Visioix Pro 2.0.0 the card shows short state names instead: supported or limited when the periods can be compared, ready when the source is connected but the periods cannot be compared, or the state of the connection. Pro shows the same readable labels as Free.
If the card says "Refresh the source data before making a decision", the data is out of date. The card also lists the exact dates of the current and previous periods.
Read the charts and findings
- Charts show Sessions, Views, Engagement (%), Search clicks, Search impressions and Search CTR (%) for both periods, with the exact daily values available as a table.
- Verified findings describe supported changes, such as a sustained traffic drop or a page whose search click-through rate is declining. Each finding shows its source and sample, and Source evidence shows the numbers behind it. Edit page opens the affected page in the editor.
- The tables of largest matched changes show the pages, channels and devices that changed most. A missing previous value is unknown, not zero.
Changes describe observations. They do not prove what caused them.
Explain, draft and plan (Pro)
On the Overview & actions tab, Visioix Pro adds actions to the findings:
- Explain these findings with AI queues an AI explanation of all findings. Each finding then shows an AI interpretation and a suggested next step.
- Suggest titles drafts alternative titles for the affected page. Review them, then use Edit page to change the title yourself.
- Add to Action Plan turns a finding into a task, with its evidence and baseline attached. See Plan actions with Action Plan, SWOT Analysis and Advanced AI.
AI requests run in the background. "AI request queued. Reload after the background worker finishes." means the result will appear on the page later. AI Insights must be turned on; see Set up the AI connection.
Record what happened after a change (Pro)
The Action follow-up observations section lists the tasks created from Growth findings.
- Complete the task in Action Plan once you have made the change.
- Wait until a completed report period of the same length as the baseline has passed after the change.
- Choose that period and click Record this later period.
Up to 12 observations are kept for each task. They describe what was measured later; they do not prove that the change caused it.
More Growth tabs (Pro)
- Smart internal links: see Add internal links with Smart internal links.
- Authors & content and Ask your analytics: see Ask your analytics and compare authors and content.
- Executive summary: click Generate executive summary for a short management summary with three priorities from the verified findings of the period. The saved period and the referenced evidence stay attached to the result.
- Recommendations & consent (also in Free): see Add the Recommendations block.
- Commerce analyst: see Analyse WooCommerce and GA4 commerce evidence.
- Trends & community: see Import topic trends and review comment signals.
- Controlled automation: see Run title experiments and A/B tests.