
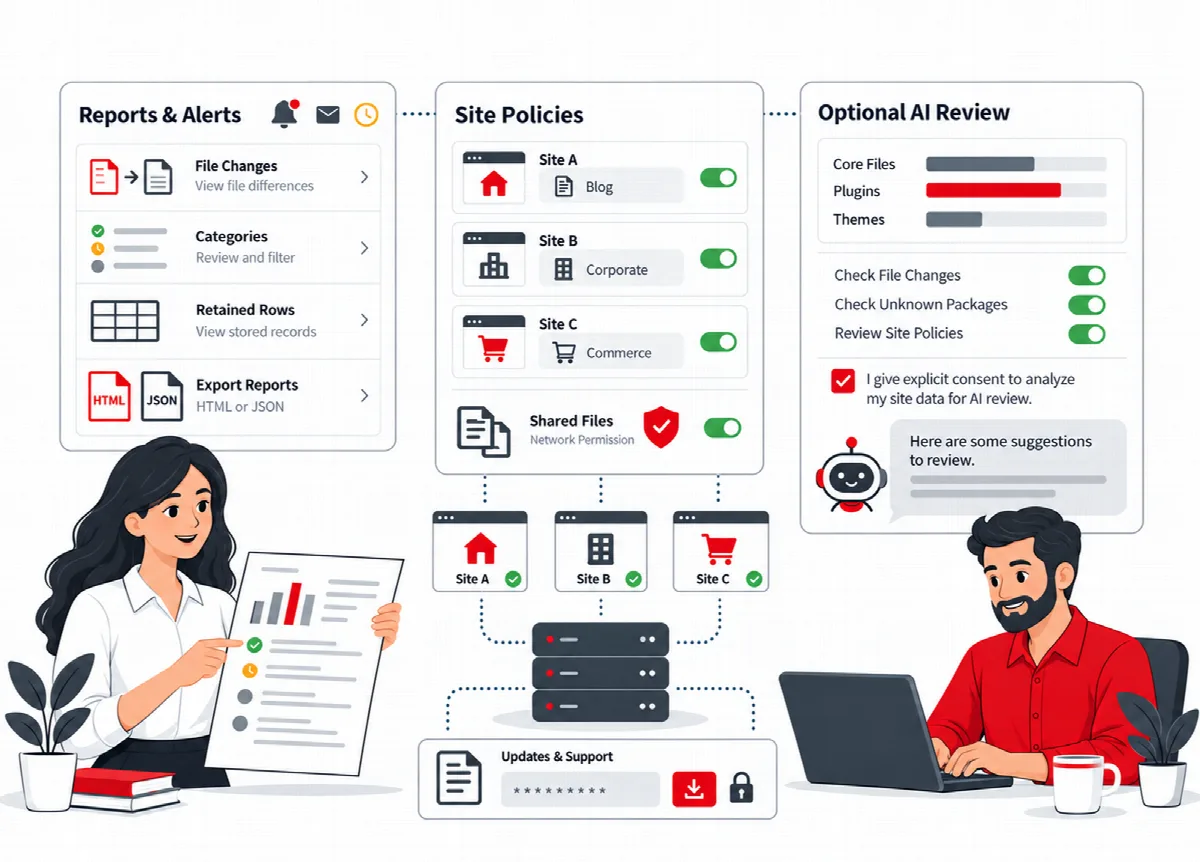
Every completed scan is stored as a report. A report keeps its own snapshot of findings, inventory, events and coverage, so you can share it later with its scope intact.
Where to find it: ARN SiteWatch → Dashboard or Reports & Events → Scan Reports for reports, Reports & Events → Event History for events.
Open a report
The latest report is shown on the Dashboard. To open an earlier one, choose it in Report history and click Open. SiteWatch keeps the last 30 stored reports. The line Stored report # shows the report number and the time it finished.
Two levels of detail
- Executive summary is for managers and owners: the review index, totals per category, the most important review priorities and the recorded protection activity.
- Technical details and the sections after it are for maintainers: each finding with its evidence, the environment and coverage, the inventory, outgoing requests, file changes, events and errors.
Both levels come from the same stored snapshot. For what each section contains, see Run scans and investigate findings.
Understand categories and counts
Findings are sorted into critical, high, medium, low and informational. The Review index describes review workload; it is not a probability that the site has been compromised.
Reports keep a limited number of details per section: up to 300 operational and 300 informational findings, 500 file changes, 500 static URL references and 300 recent events. Sections show how many items are shown, retained and found in total, so you can see when a limit was reached.
Recorded protection activity counts the policy actions recorded in the site's journal, for at most 24 hours since collection began. Matches in Observe mode and failed passwords are not counted, and plugin or account review holds are listed separately from blocks. A recorded action is a policy result, not proof of an attack.
Older reports created before this information existed say that it was not recorded.
Export a report
With a report open:
- Download HTML creates a readable copy that also prints well on A4.
- Download JSON creates structured data for other tools.
- Email this report sends the report to the report recipient with the transport set in Settings → General & Report SMTP.
Reports contain site addresses, file paths, account names, installed products and technical details. Review a report before you share it outside your maintenance team. An export does not remove the detail limits of the report and does not bring back history that was already deleted.
Filter and export the event history
Reports & Events → Event History lists recorded events such as sign-ins, role changes, plugin operations, policy changes and mail limits.
- Enter an Event kind to filter, for example
role,mail_limitorupdate. - Set Days (1 to 365).
- Click Filter history. The list shows the latest 100 matching events.
- Click Export filtered events (up to 1,000) to download the matching events.
What the history can show depends on the retention period, the events SiteWatch records and a limit of 20 events per PHP request. Events from before SiteWatch was active are not available.