
The Performance screen compares query and page measurements for a topic over time. The data comes from rows you paste or from a Google Search Console connection. Use it to find the pages worth improving and to measure the effect of a refresh.
Where to find it: ARN Contix → Growth → Performance. Choose the project and topic and click Open performance workspace.
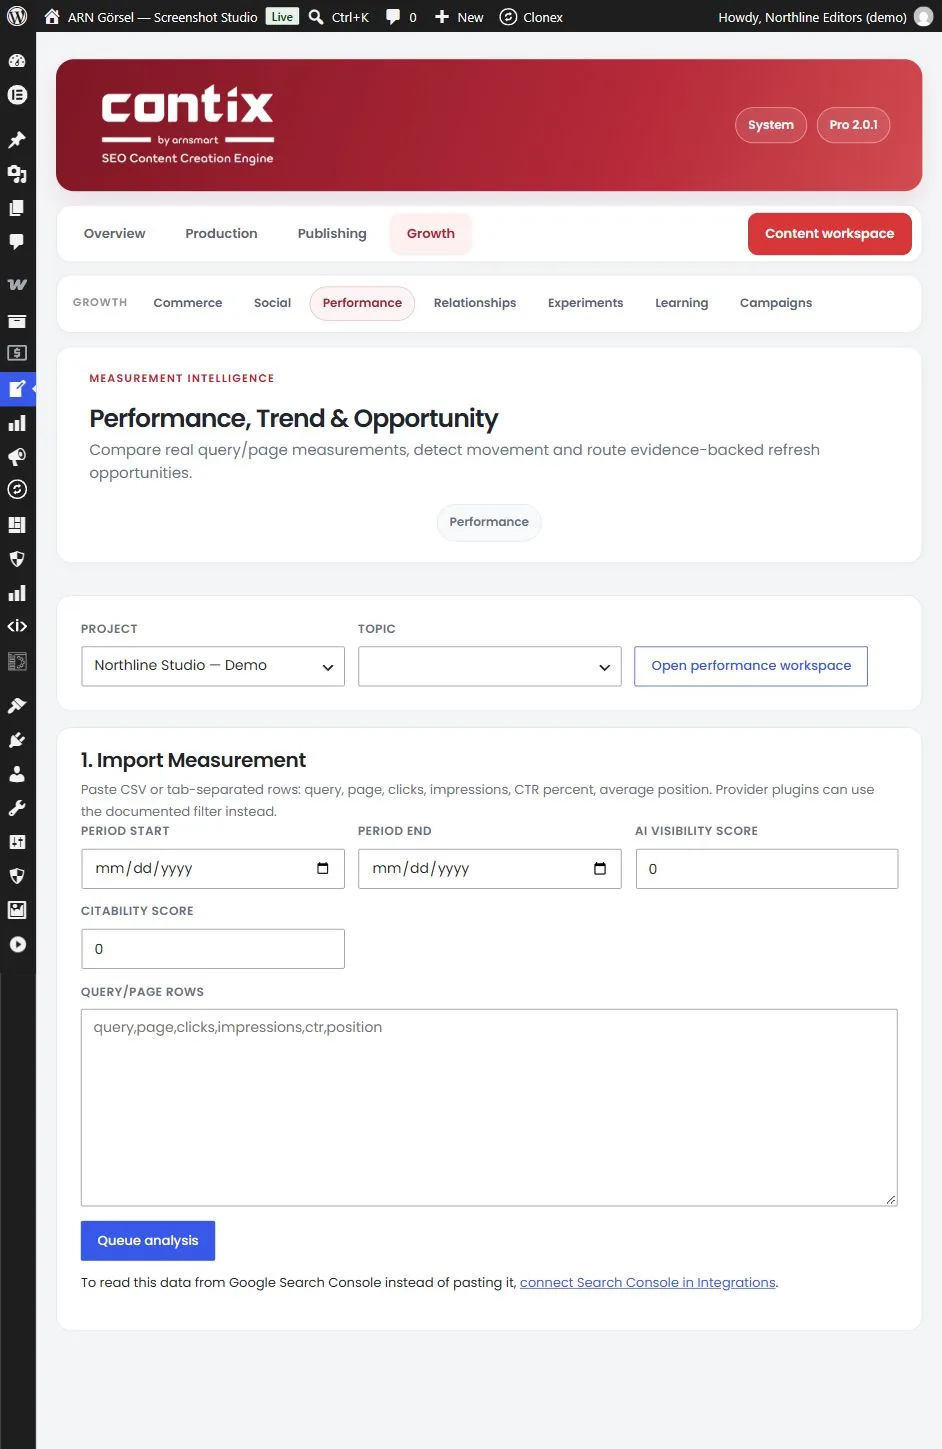
Import measurements by pasting rows
- Under 1. Import Measurement, enter the Period start and Period end.
- Paste CSV or tab-separated rows into Query/page rows, one row per query and page: query, page, clicks, impressions, CTR percent, average position. For example:
query,page,clicks,impressions,ctr,position. - Optionally, enter an AI visibility score and a Citability score from your own measurements.
- Click Queue analysis.
A row without numeric clicks and impressions is skipped, and the notice tells you how many rows were skipped.
Sync from Google Search Console
When a Search Console connector is active for the project, the Performance screen shows Sync from Google Search Console. Enter the period and click it. Contix reads the clicks, impressions, CTR and position of the topic directly. If no connector exists yet, the screen links to connect Search Console in Integrations.
Connect Search Console
Contix connects to Search Console with a Google Cloud service account. Set it up once per project:
- In Google Cloud, create or open a project, enable the Google Search Console API and create a service account.
- Create a JSON key for the service account and download the file.
- In Search Console, open your property, go to Settings → Users and permissions and add the service account's email address as a user. Restricted permission is enough.
- In Contix, open System → Integrations and go to 2. Google Search Console.
- Enter a Name, the Search Console property (for example
sc-domain:example.com) and paste the complete file into Service account JSON key. - Click Save connector, then Test to confirm the access.
The key is stored encrypted (AES-256-GCM) and is never exported. If saving fails, paste the key again; for security it is not kept after a failed save. A connector saved by an older Contix version whose type is no longer supported is marked "(no longer supported)"; delete it.
Search Console data is optional. You can always paste rows instead.
Read the movement and alerts
The totals show Clicks, Impressions, CTR, Average position and the trend.
Under 2. Movement & Alerts, Contix compares the latest two snapshots of the topic. The first snapshot is the baseline. When a page declines, the alert links to a refresh audit with Open refresh. See Refresh existing posts with 301 redirects.
Review quick wins
Under 3. Quick Wins, rows with high impressions that rank between positions 4 and 20 are listed with their query, page, impressions, CTR and position. These are good candidates for a refresh or a title test.
For developers
Plugins can supply normalized performance rows through the contix_performance_rows filter instead of pasted rows.