
Contix Pro runs research, writing, analysis, publishing and growth work in a background queue. The Queue screen shows every job, and the Operations screen shows the health of the queue, the recorded AI usage and cost, and the logs.
Where to find it: ARN Contix → Publishing → Queue and ARN Contix → System → Operations.
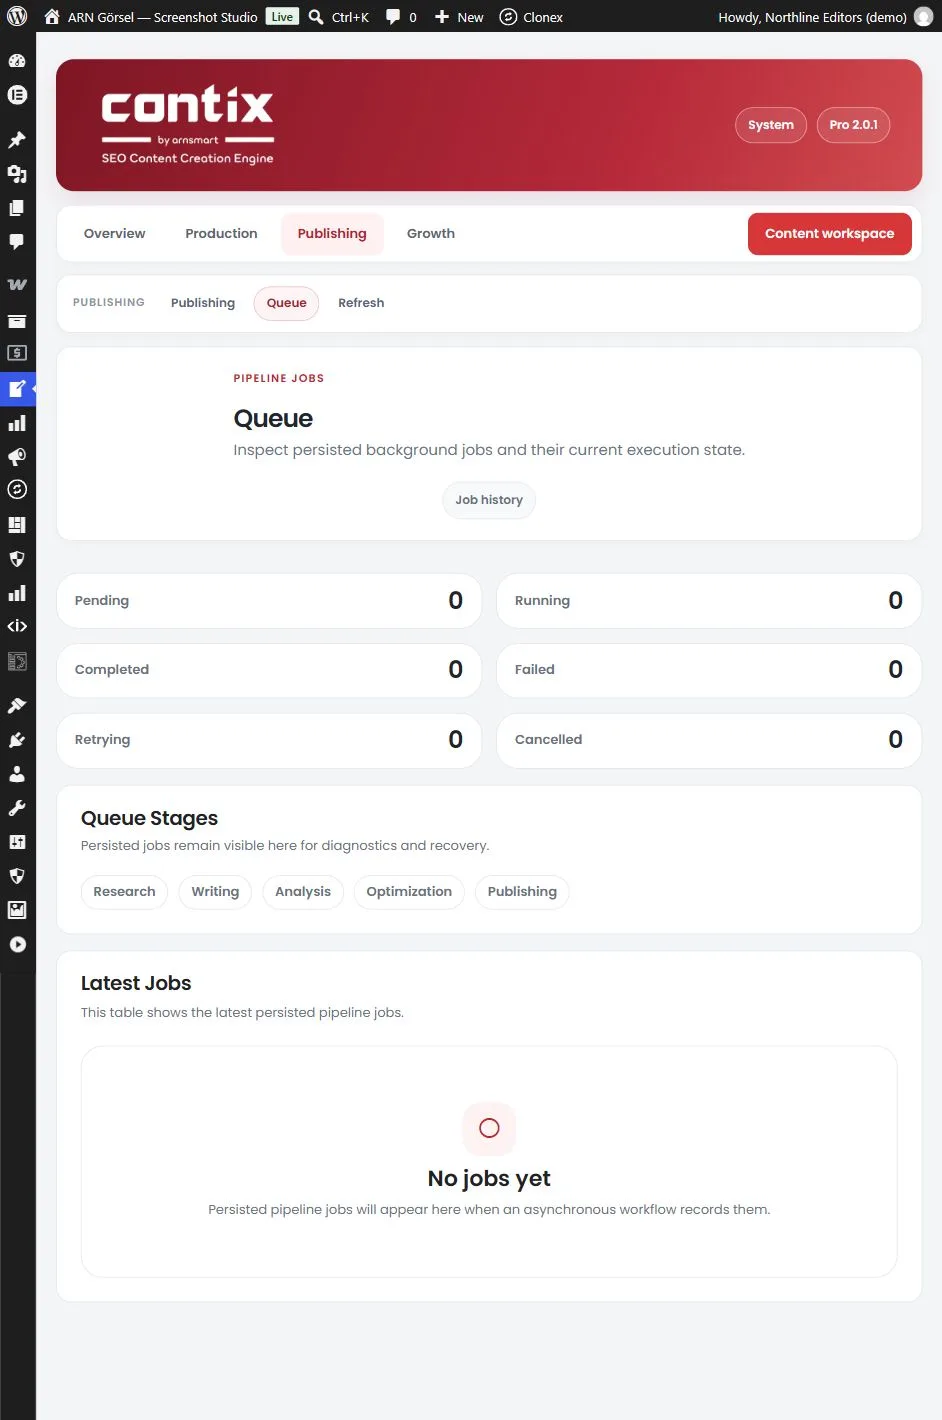
The Queue
Latest Jobs lists the background jobs with their Type, Status, Priority, Progress and the time they were last Updated. A failed job shows the reason it failed.
- The Queue screen is the one place to Cancel or Retry a job.
- Queue screens update while a job runs and reload with a notice when it finishes.
- Read the recorded failure before you retry. Fix provider access, missing inputs or other causes first.
- Identify a job by project, topic, stage and run rather than by its age alone, and continue an existing run instead of starting a second one for the same topic.
Operations: system and queue health
System → Operations starts with the recorded Requests, Tokens, Recorded cost, Failed requests and Dead jobs.
System & Queue Health shows the database schema and required tables, whether cron is available, whether the loopback works, the runtime state, the providers that are ready and the environment, without showing credentials.
- Pause global runtime stops all background work of Contix on this site; Resume global runtime starts it again.
- If Cron shows "Disabled — configure a real system cron.", WP-Cron is turned off on your site. Ask your host to add a server cron job for
wp-cron.php.
Recorded usage and cost
Usage & Cost Controls lists the recorded requests, tokens and cost by provider and model, and by action and stage. Filter by date, Provider, Model, Project ID or Topic ID and click Filter usage. Tokens are the units providers count when they bill a request.
Contix records the cost of each request from the token prices under Settings → ARN Center → Model prices. A request to a model without a price is recorded as Unpriced (or as the priced cost plus the number of unpriced requests), not as a zero cost.
Note: In Contix Pro 2.0.0, every request was recorded with zero cost, so the cost caps below never stopped work. Update to 2.0.1 if you rely on cost caps. Usage rows recorded before the update keep their values.
The provider's invoice remains the record of what you pay.
Set cost caps
| Cap | Where | What it limits |
|---|---|---|
| Daily cost cap | System → Operations | Recorded cost per day |
| Per-project lifetime cap | System → Operations | Total recorded cost of one project |
| Campaign cost cap | Growth → Campaigns | Recorded cost of one campaign |
- A zero cap means unlimited.
- When the recorded cost reaches a cap, jobs stop before the next provider call.
- Caps count only priced requests. While a cap is set and the selected AI model has no price, Operations, Settings, Campaigns and Learning show a warning with a link to Model prices.
Click Save operations settings after a change.
Logs
Central Log Center shows runtime, pipeline, provider and transfer events.
- Filter by Severity, Stage, Job ID or a search term and click Filter logs.
- Export CSV exports the filtered events.
- Download debug bundle downloads a diagnostic bundle without secrets, for support.
What exports may contain is set under System → Backup & Restore → Privacy controls. See System Health, backups and data deletion.
Retention
Contix cleans old records after the number of days you set (1 to 3,650):
| Setting | Default |
|---|---|
| Log retention (days) | 30 |
| Completed job retention (days) | 30 |
| Usage retention (days) | 365 |
| Pipeline event retention (days) | 180 |
| Completed run retention (days) | 365 |
Saved content revisions are always kept. A cleanup run removes up to 1,000 eligible rows per table and never removes active jobs. Run retention cleanup starts a cleanup right away.
When jobs do not move
- Check the current checkpoint in Production → Production. A Guided run may be waiting for your approval.
- Check the job and its failure reason in Publishing → Queue.
- Check System & Queue Health in Operations and System → System Health.
- Make sure the global runtime is not paused.
- Ask your host to check cron and server errors.